
The Dashboard provides a focused view of project schedule health and delivery risk. It highlights milestones, blockers, critical-path tasks, and schedule delays so that users can quickly see what may affect project completion.
1. What Is the Dashboard Tab?
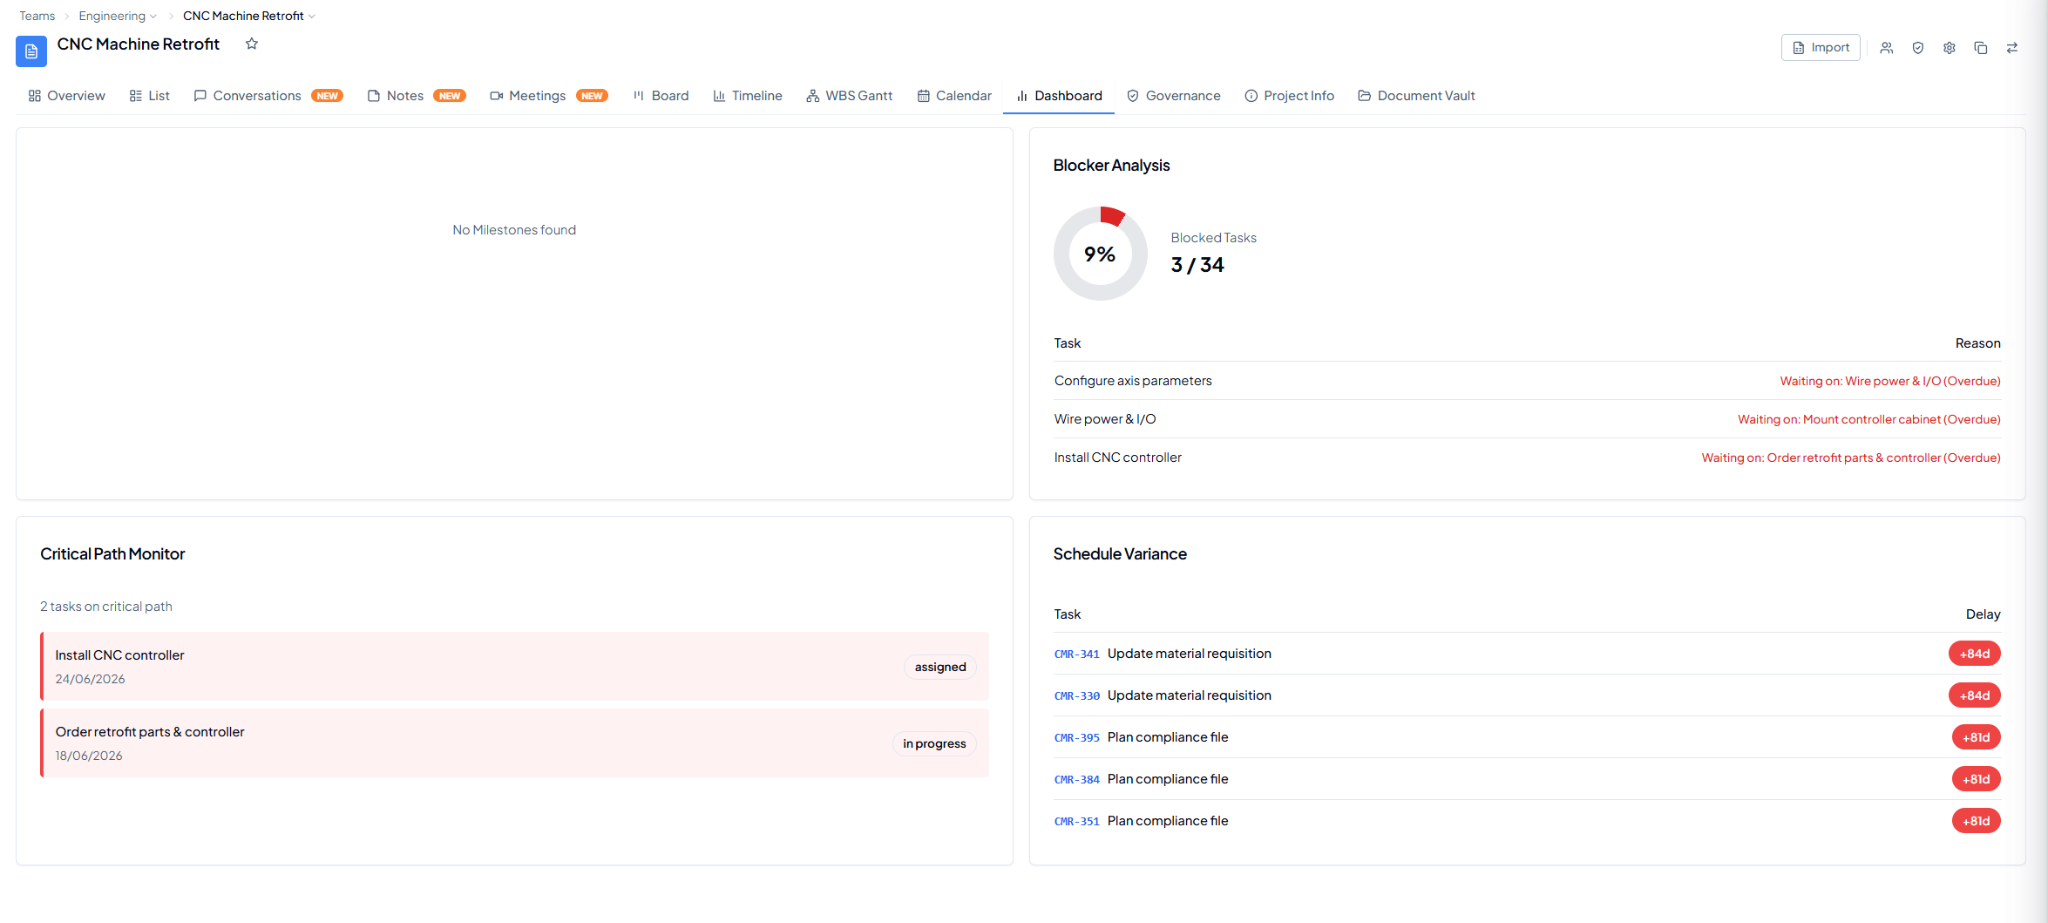 Dashboard showing Blocker Analysis, Critical Path Monitor, and
Schedule Variance.
2. Dashboard Sections
3. Why Is This Helpful?
- Quickly identify active blockers.
- See which tasks can directly affect the completion date.
- Spot tasks that are running behind schedule.
- Focus project reviews on the items that need immediate attention.